
big data
Big data poised to navigate growers to their targets
With cultivation so closely intertwined with the Internet and with the advent of crop and climate sensors, big data is becoming available to the greenhouse horticulture sector. Big data consists of huge collections of information that growers can use to optimise operational aspects such as crop growth and energy consumption. A consortium of companies and organisations is working on the calculation models and algorithms that should make a comprehensive management program possible. “Think of it like a satellite navigation system (satnav): the grower enters a target and the program guides them there.”
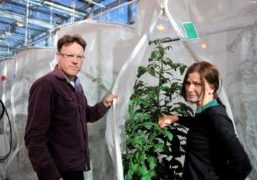
“Imagine you’re a tomato grower. Wouldn’t it be great if you could manage your yields, quality and harvesting times even more accurately than you do at present. What buttons should you press to achieve that? That’s what we’re working towards,” says Simon van Mourik, Assistant Professor at the Farm Technology Group at Wageningen University & Research in the Netherlands, where he works on intelligent agri-systems based on precision technology and data streams.
Alternative route
Van Mourik has teamed up with energy specialists AgroEnergy to lay the foundation for a joint research project. The university, the energy partner for greenhouse horticulture and a number of companies and organisations were recently awarded funding for this project, which is entitled “Energy saving in greenhouse crop production by flexible management” and goes by the working title “FlexCrop”. The research project will start in a crop of artificially lit tomatoes next summer. The consortium also includes the Dutch growers’ organisation LTO Glaskracht and the companies B-Mex, LetsGrow.com and Delphy.
Developing a management program based on big data is no small matter. A period of four years has therefore been allowed for FlexCrop. There are a lot of requirements to be met. First of all, the program must be able to adjust for temporary fluctuations, just as a satnav recommends an alternative route for the driver if there is congestion ahead. “This dynamic must be built in. So the program must steer dynamically. In terms of climate and energy consumption, for example, that can be done by adjusting the settings hour by hour based on the most recent data,” says van Mourik.
Analyse and interpret
All the relevant cultivation factors must be built in. For example, B-Mex is looking at forecasts from changed settings. Take the CO2 dosage. What happens if the grower increases the concentration of CO2? What would that cost? And what would it deliver in terms of crop growth or extra kilograms of product? Based on the measurements and calculations, the program must be able to recommend the best and most cost-effective CO2 dose for the crop.
Van Mourik: “Next Generation Growing has already taught us that a crop is very flexible. With even more information about this, we can develop an algorithm that optimises the settings accordingly. That calls for models that predict the consequences of a particular action or situation. These models do already exist but they are not yet perfect. The challenge is to analyse and interpret the enormous volume of data in the right way.”
Two PhD students are helping with the research. One is working on knowledge of crop physiology and the other is working on an algorithm that utilises the flexibility of the crop. “In this project, the trick will be to make the best use of all the partners’ expertise,” the Dutch scientist says.
For growers, the datasets on which the management information system is based are invisible. Will they have the courage to trust the advice? Van Mourik thinks so. “Look at the satnav. You don’t know how it works but you still follow the instructions and you do what the screen on the dashboard tells you to. ‘After 300 metres, turn left’ – and you really do turn left after 300 metres. And that gets you where you need to go.”
Intertwined with business aspects
One example of where big data can take us is BiedOptimaal from AgroEnergy. This program calculates the optimum APX bid for the next day based on extensive data sets and prediction models. More than 130 growers are already using it every day. There’s a lot to be got out of the energy market for the grower, AgroEnergy product developer Peter Goudswaard explains. “Energy is an important part of the cost price and energy prices can fluctuate strongly on the APS and the intraday market. With the right APX bid and by adjusting for intraday, you can use the program to make significant savings in energy costs and time.”
At the moment the company is working on a series of additional solutions designed to help growers with everyday issues. There’s no shortage of examples. Goudswaard: “Is it worth switching on the lights or would it be better to leave them switched off? What would it cost you in the first scenario, and what would you save in the second? And what does the crop do when the lights are on or off? What extra yields could you get, and what costs would be involved? The program doesn’t approach the cost factor of energy in isolation and is becoming more and more closely intertwined with many areas of production, climate and day-to-day operational aspects. We are working with a number of partners on this.”
Support for decision-making
Goudswaard’s colleague Bram van Rens is a data scientist at the Delft-based energy specialists: “The yield has to come from cultivation, whereas climate is a cost factor. It takes time if the cultivation manager and the energy manager keep having to meet because the cultivation manager wants to switch on the lights to boost growth and yields while the energy manager wants to feed energy back into the grid because prices are good at that point. Their objectives differ, but cultivation and energy are both factors in the company’s bottom line: they have to go hand-in-hand.”
Big data makes it possible to provide advice that will highlight the optimum, van Rens believes. “With systems that support decision-making we can make things easier for the grower. As sensors and the Internet of Things produce more and more information and data, there is an increasing need for this.”
Less to the daily market, higher mid price
The Dutch company HortiKey is working on other applications based on big data. The company’s latest innovation is the Plantalyzer, which has been developed for tomatoes to begin with.
The autonomous measuring system photographs the colour of the tomatoes on a scale from 1 to 12. The measurements are then used to produce a forecast of the harvest in kilograms two weeks in advance. This is very handy. After all, if the grower knows that in two weeks’ time he will be producing more than he is contracted to deliver to the customer, his sales staff can start looking for alternative outlets. General Manager Andreas Hofland: “Otherwise they have to get rid of the surplus on the daily market, where prices almost always put pressure on their mid price. With this system, you can reduce the normal margin of error in production planning by around ten percent.”
When all is said and done, the measuring system is a sales tool, Hofland says. But it is a little more than that, because it also highlights production differences and can detect colour variations. “If some trusses are ripening differently from the others, this tells the crop manager that there has been a problem there. If he is able to find out exactly what that is, that mistake can be avoided in the future – even if it was only a leaking window. This is a way for inquisitive growers to get their hands on a wealth of new information.” The company mainly specialises in applications for large fruiting vegetable nurseries. That’s a strategic choice, because these nurseries are becoming larger and larger the world over, and yet it is becoming harder to find good crop managers and the risks (in other words, errors in cultivation or production) still have to be eliminated.
Summary
The trick with big data is to recognise patterns in the enormous streams of data and convert them into information that can be applied to the grower’s day-to-day practice. Various parties in the greenhouse horticulture sector are working hard on this. A consortium is developing a management information system based on big data, for example, and one company is focusing on yield forecasts that helps growers manage production and sales even more precisely.
Text and images: Jos Bezemer.
Related



How Dutch Sprouts wants to conquer the world
Henri Hekman was major shareholder of the BLGG Group, the leading laboratory for soil analysis. In 2013 he sold the company to Eurofins. But instead of enjoying his retirement, he chose to start something new. Inspired by his analytical background but with the addition of IT and statistics, he founded Dutch Sprouts.
The choice was easy for him: "Starting something new was simple: I had the knowledge, money and people. So the question was not why, but rather why not? Besides, I wanted to do something for humanity and this was the ideal chance."
Soil samples
Dutch Sprouts offers a number of products, of which products for the analysis of soil samples are the most important ones. Every farmer knows that the composition of the soil is important: the nutrients that are in it decide what can be grown and how much of it. Worldwide the soil composition is mainly determined by chemical analyses. Based on these results, a fertilizer recommendation is made. The analysis of a soil sample can easily cost 60 to 70 euros and is daily practice, at least in most parts of the Western world. However, this is very different in, for example, Africa, Asia or Eastern Europe. Farmers in those parts of the world do not have the right techniques at their disposal nor the financial resources."
"The SoilCares scanner, not bigger than a drill, allows you to take a sample anywhere in the world. The data are sent to our computers via a smartphone."
"Especially for this group, we have found a solution. We have made a link between the digital scan of the ground based on the infrared sensor and the chemical analysis. By taking 1500 samples and analysing and validating the scans, we can now predict which substances are in the soil based on the scan. The scan is, as it were, extrapolated with existing data."
Soil scanner
"It provides a whole new business model. The SoilCares scanner, not bigger than a drill, allows you to take a sample anywhere in the world. The data are sent to our computers via a smartphone. Within seconds the analysis is made and sent back. Payment is done through the local telephone network. No more expensive analyses: just a few dollars. It is real-time and also manageable for poor farmers! Not only an analysis is made, but also an instant fertilizer recommendation tailored to the local availability of raw materials."
"If you translate this concept into marketing terms, mass is the keyword. Many small amounts together eventually lead to profits."
"If you translate this concept into marketing terms, mass is the keyword. Many small amounts together eventually lead to profits. Fortunately, there are a lot of farmers in the world and more poor ones than rich ones. The reason that we are mainly active in developing countries is not only based on social grounds, but simply on commercial considerations."
You must be heavily betting on sales and marketing if you want to conquer the whole world?
"Not really. The key is that this technique is game-changing. We see a production improvement of 50% up to double the output. Believe me, that's not difficult to communicate. We are already being approached by cooperatives and growers from all over the world. Even governments contact us."
Governments?
"Yes, a doubling of the production transcends the interests of individual farmers. Quite apart from the fact that some countries want to be self-supporting, the economic contribution is so significant that the gross national product is affected."
Does every farmer have to buy its own scanner?
"We sell the scanner at cost, approximately 2,000 euros, and that is of course getting cheaper as the sales increase. It is expected that there will be a new market for intermediaries. They measure the soil; the farmer pays them, for example, $ 5 and the intermediary pays us $ 3 per analysis. Larger cooperatives for, amongst others, coffee, sugar and grain, and large farmers will obviously buy their own scanner."
"Technique sells itself: have you ever been contacted by Facebook with the request to open an account?"
Henri continues: "Furthermore, we have also developed a compact laboratory for this group, the Lab-in-a-Box. This compact laboratory measures more accurately than the scanner, and can be placed on a jeep, if desired. We already have 30 orders for the lab-in-a-box, especially from East Africa, as well as Ukraine and the United States. An analysis with the Lab-in-a-box is more complex and takes more time than an analysis with a scanner, for which more support is needed from the Netherlands. We will not open our own offices for the scanners. We will just start from the analogy of the drills and expect the SoilCares scanner to eventually be sold through sites like Amazon and Bol.com. "Technique sells itself: have you ever been contacted by Facebook with the request to open an account?"
Scoutbox
Another innovative product is the Scoutbox, especially designed to identify and count pest insects. This is also based on digital technology and databases: sticky traps hanging in greenhouses to monitor pest insect population are automatically counted and analysed. The sticky trap is placed in the Scoutbox and a digital picture is made."This picture is sent to our computers and a count is made of the insects and the type of insect is determined. The gardener then gets an overview on his computer with the type of insects and how many insects are present in his greenhouse and where. A lot of tomato growers in the Netherlands are already using the Scoutbox. "
"The market demands more: we are now working to develop a database for trips, so the Scoutbox can also recognise and count these trips."
"The market demands more: we are now working to develop a database for trips, so the Scoutbox can also recognise and count them. Trips are tiny bugs that can be found on plants and flowers, and which may cause problems for export."
Why develop? It is exactly the same system, isn't it?
"Yes, but you have to realize that we have to interpret the pictures correctly and that requires a lot of programming. A tiny fly that flies against a sticky trap, sometimes bursts in different pieces. Our software then needs to reconstruct a head, leg or wing to one fly so it does not count them as three flies. IT is our R&D!"
Finally, Mr. Hekman would like to give an advice to the agricultural world: “Manage your business in a more rational way! A farmer might see his cow as Klara 2, I see it as a factory. There is input, output and residues. The point is to optimize this and that is only possible with IT and lots of sensors. Knowledge is power, which is something well known, but it is still unexplored ground in this sector. Even the process in a modern greenhouses can be further optimized."
"Forget what you've learned from your predecessors. Let statistical software find a causal link between all measured variables, because believe me, there is one!"
With thanks to: Exportmagazine.nl. Photo: Dutch Sprouts.